C.A.P. Momentum
a systematic approach to wealth building
Evidence -Based Momentum Strategy for Modern Investors

© 2026 CapXMomentum. All rights reserved.
About
"C.A.P. Momentum, the missing engine of your financial architecture."A well-crafted financial plan without a dynamic execution strategy is like a luxury vehicle without an engine.It may provide a sense of comfort, safety, and prestige, but it lacks the fundamental power to move you toward your destination.With our Algo-Assist Momentum Signal Service, you've got the power!

© 2026 CapXMomentum. All rights reserved.

C.A.P. Momentum
"The Perfect Synergy"While Dual Momentum optimizes the precision of market timing for entries and exits, the C.A.P. Framework establishes the essential diversification and risk management foundation required for long-term capital preservation and stability.- Low Volatility: Designed for steady, long-term growth.
- Trend Following: We buy during the ascent and sell at the start of the decline.
- Data-Driven: No guesswork, only quantitative rules.
- Customizable: While the logic is fixed, the strategy can be tailored to individual needs.
C.A.P.
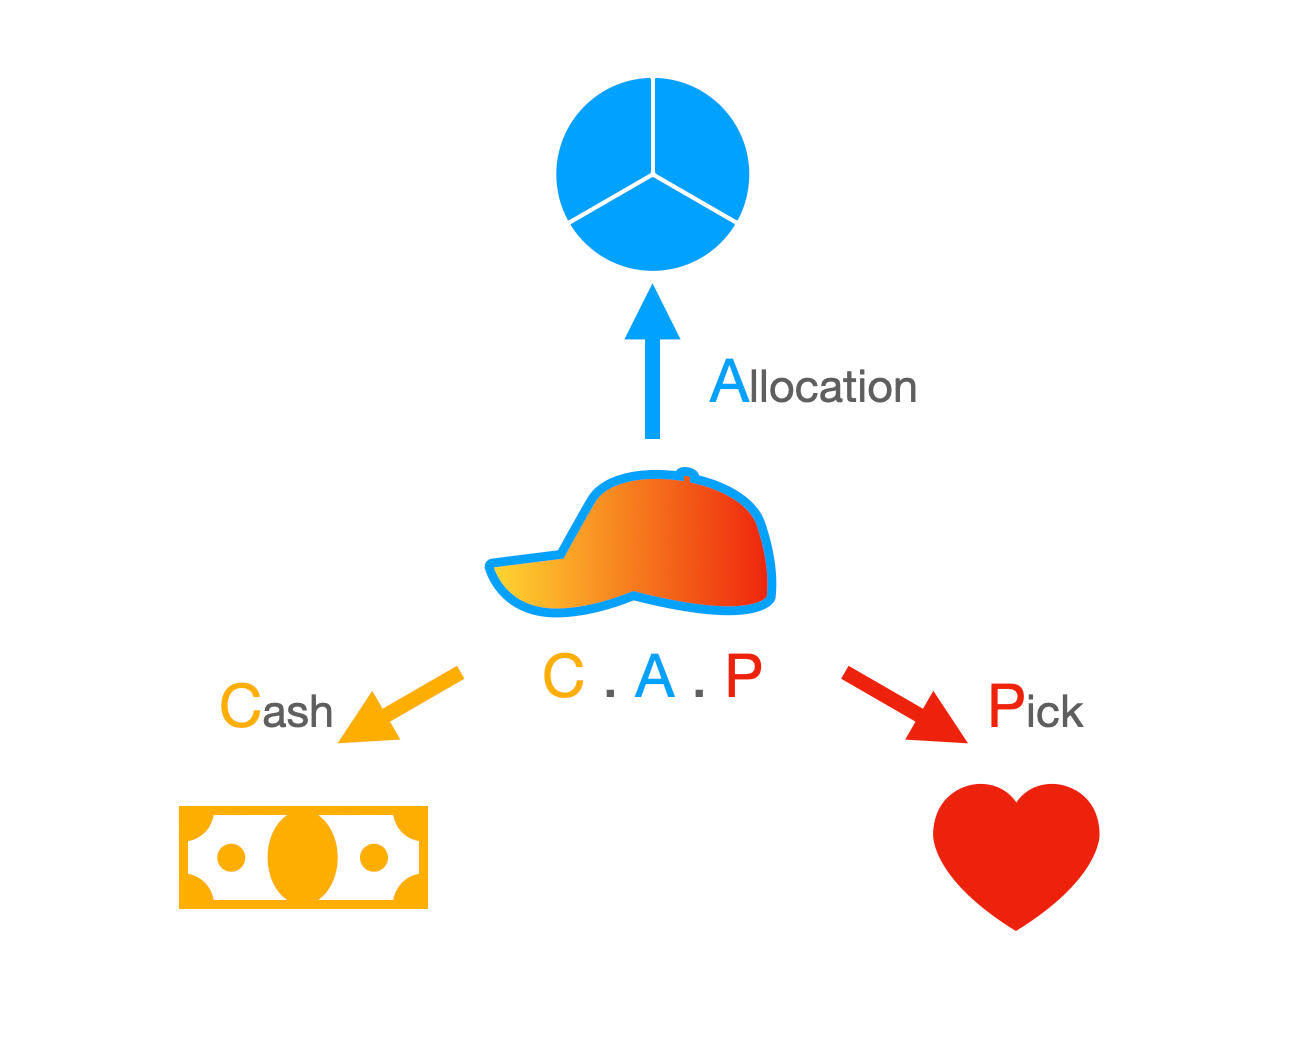
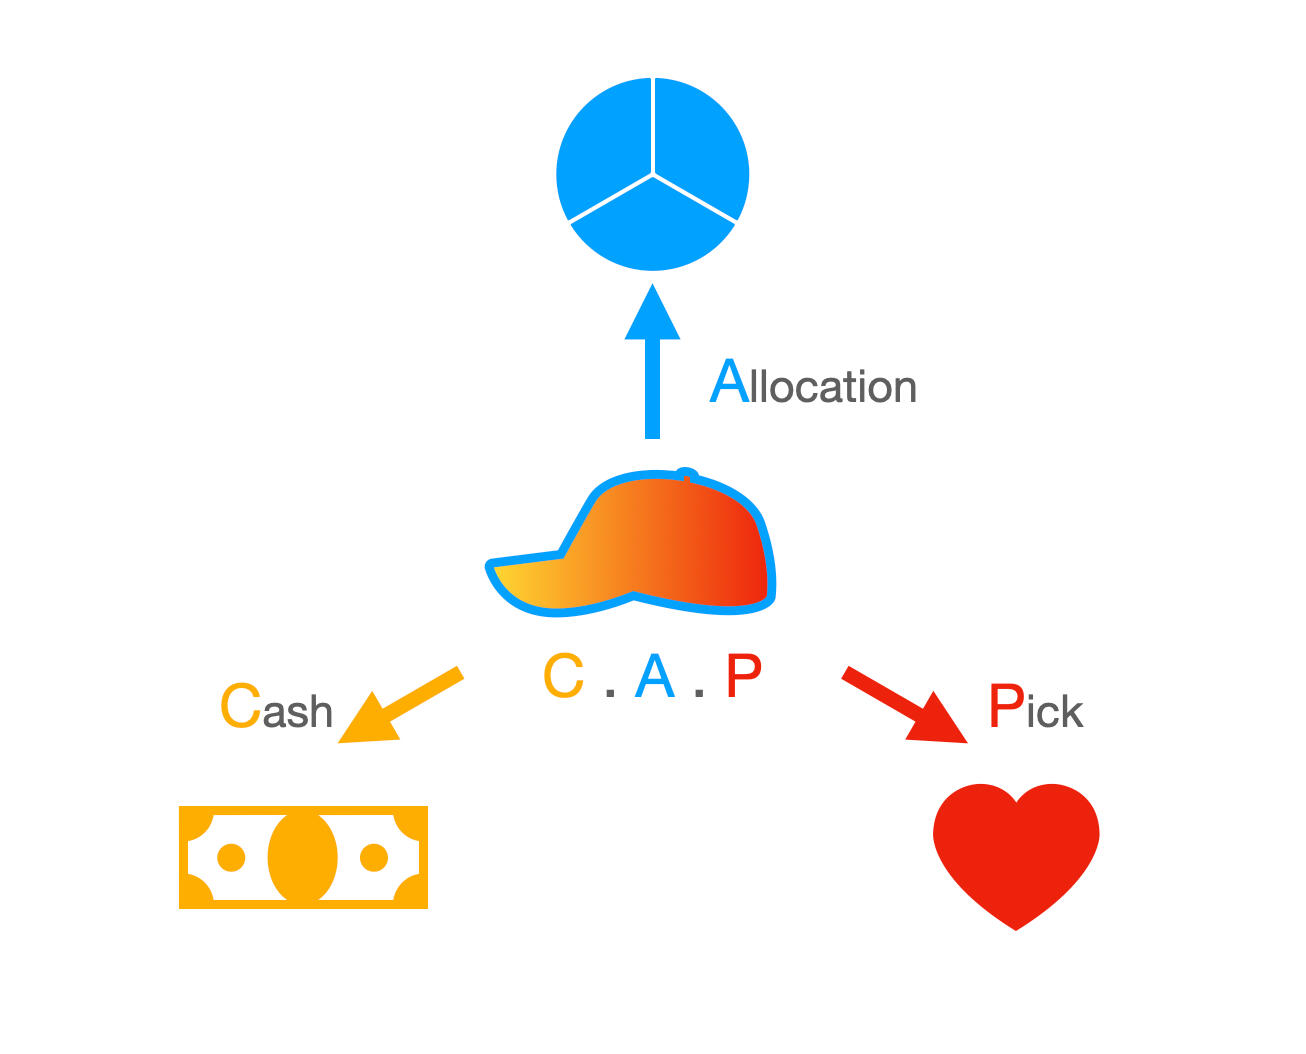
" A disciplined framework for modern portfolio management"The C.A.P. Framework is a tactical allocation strategy designed to manage your portfolio through 3 core pillars:C – Cash: Strategically increase cash holding when market conditions deteriorate.
A – Allocation: Systematically distributing capital into selected assets.
P – Pick: Focusing on high-quality, high-potential asset options.
Dual Momentum
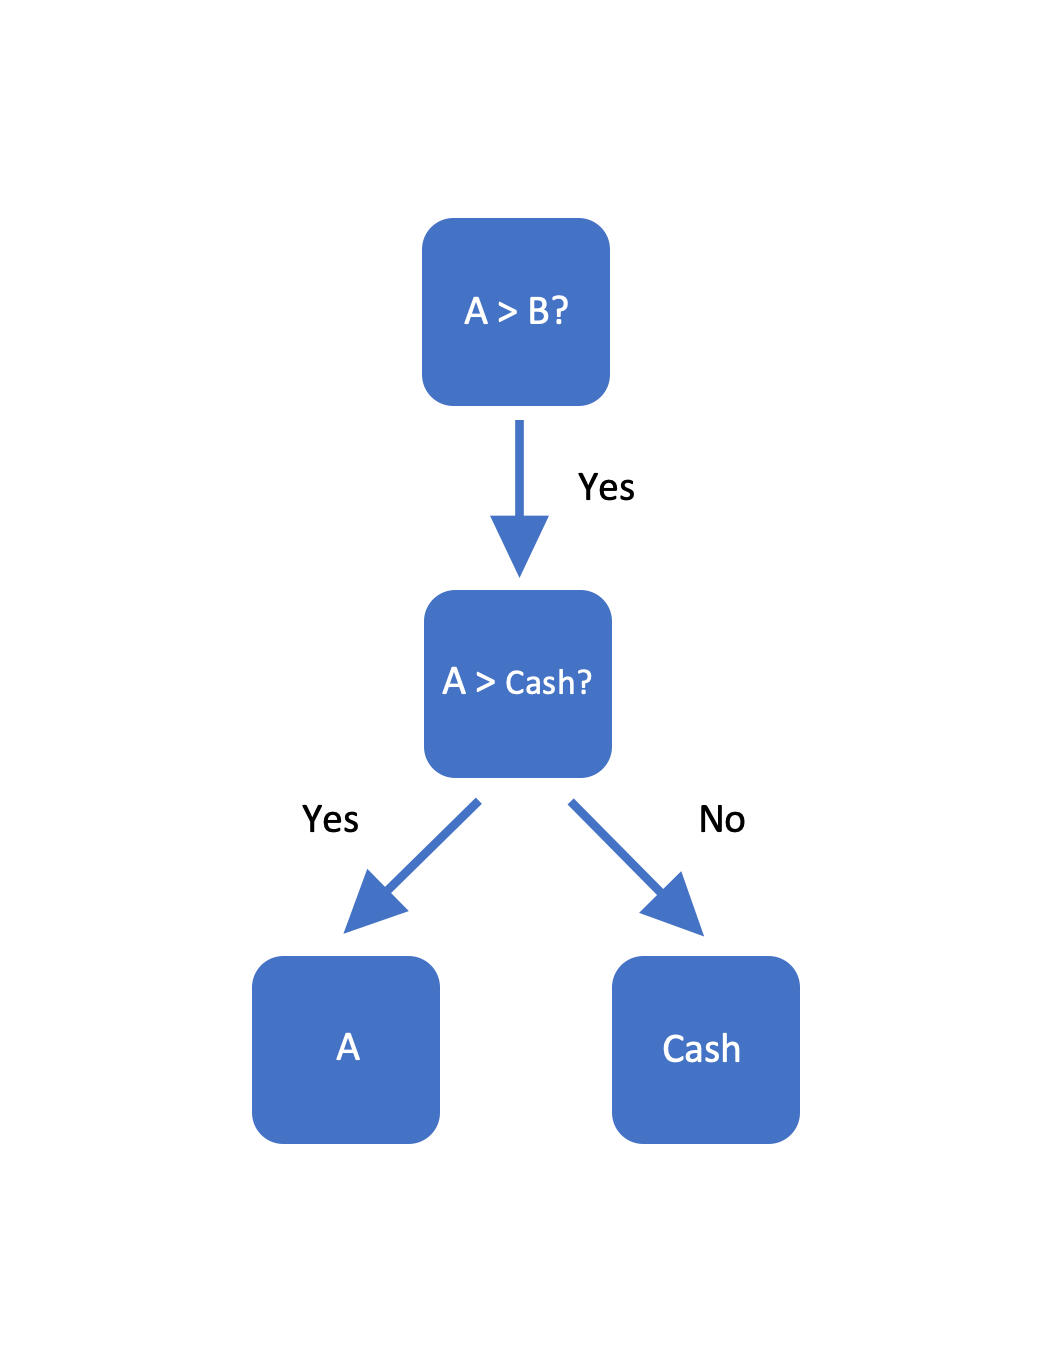
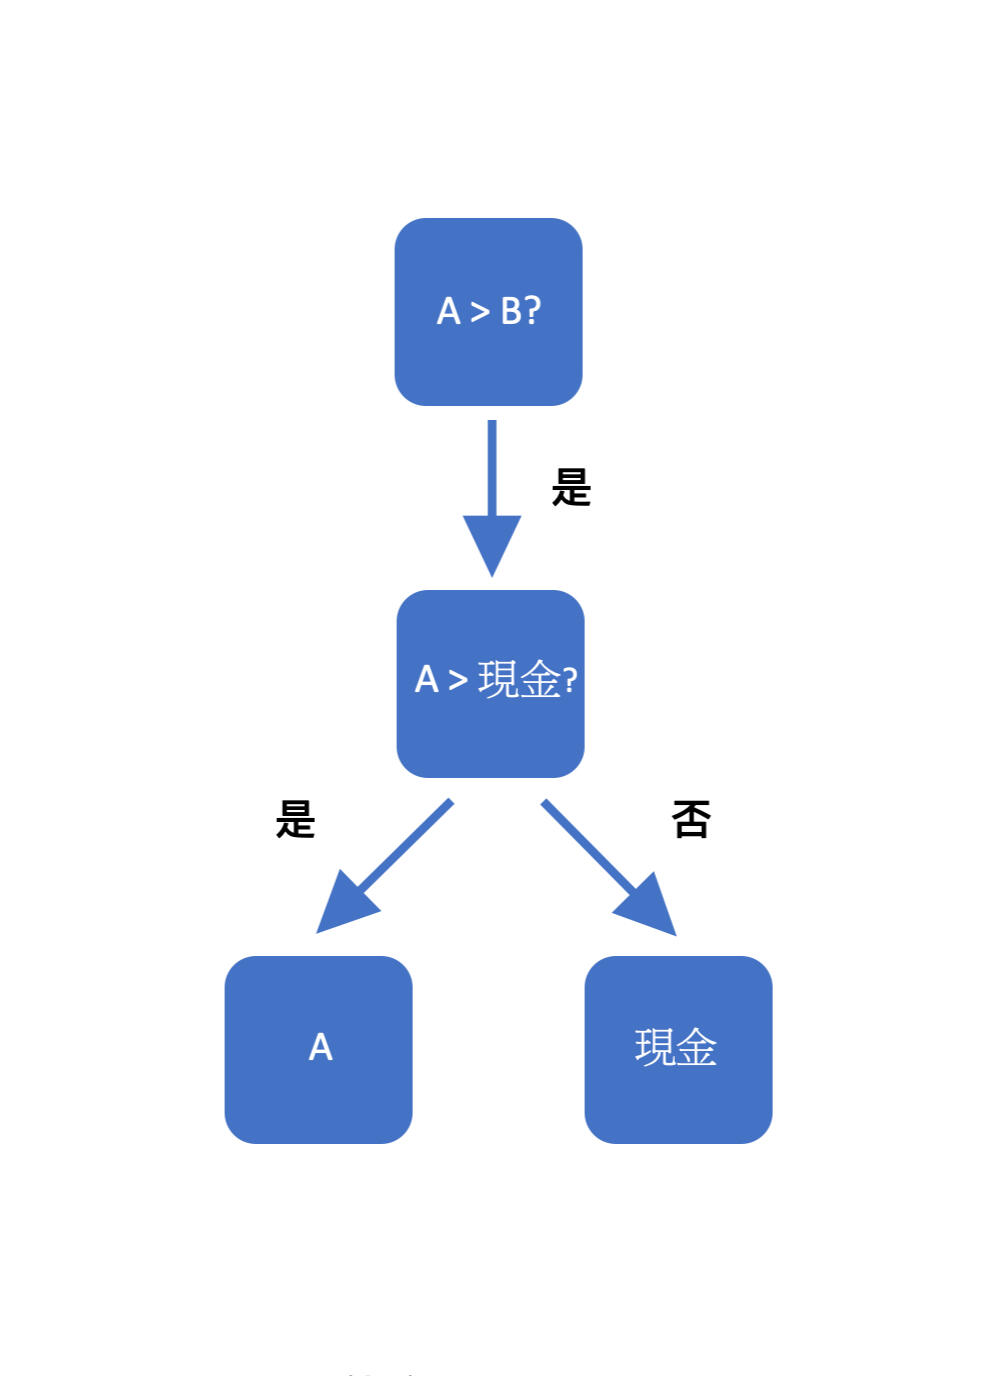
"Embrace Momentum"We use a two-layer quantitative filter to capture bull markets and evade bear markets.A simplified explanation:
Step 1: Relative Momentum Check
Is Asset A outperforming Asset B?
(e.g. U.S. Stocks vs. International Stocks)Step 2: Absolute Momentum Check
Is the winning asset outperforming Cash/ Defensive assets?
Yes: Invest in the Winner
No: Hold Cash/ Defensive Assets
© 2026 CapXMomentum. All rights reserved.
CAP-01 & CAP-01P
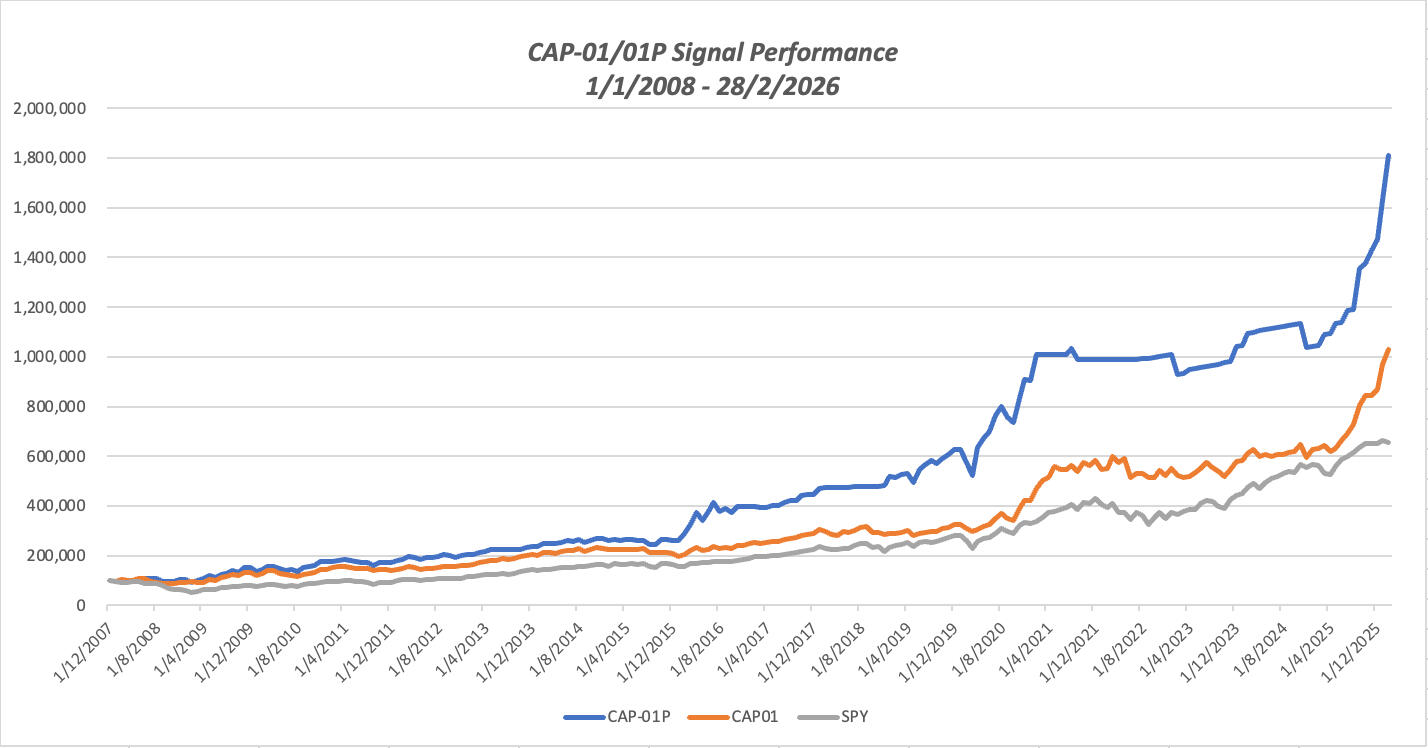
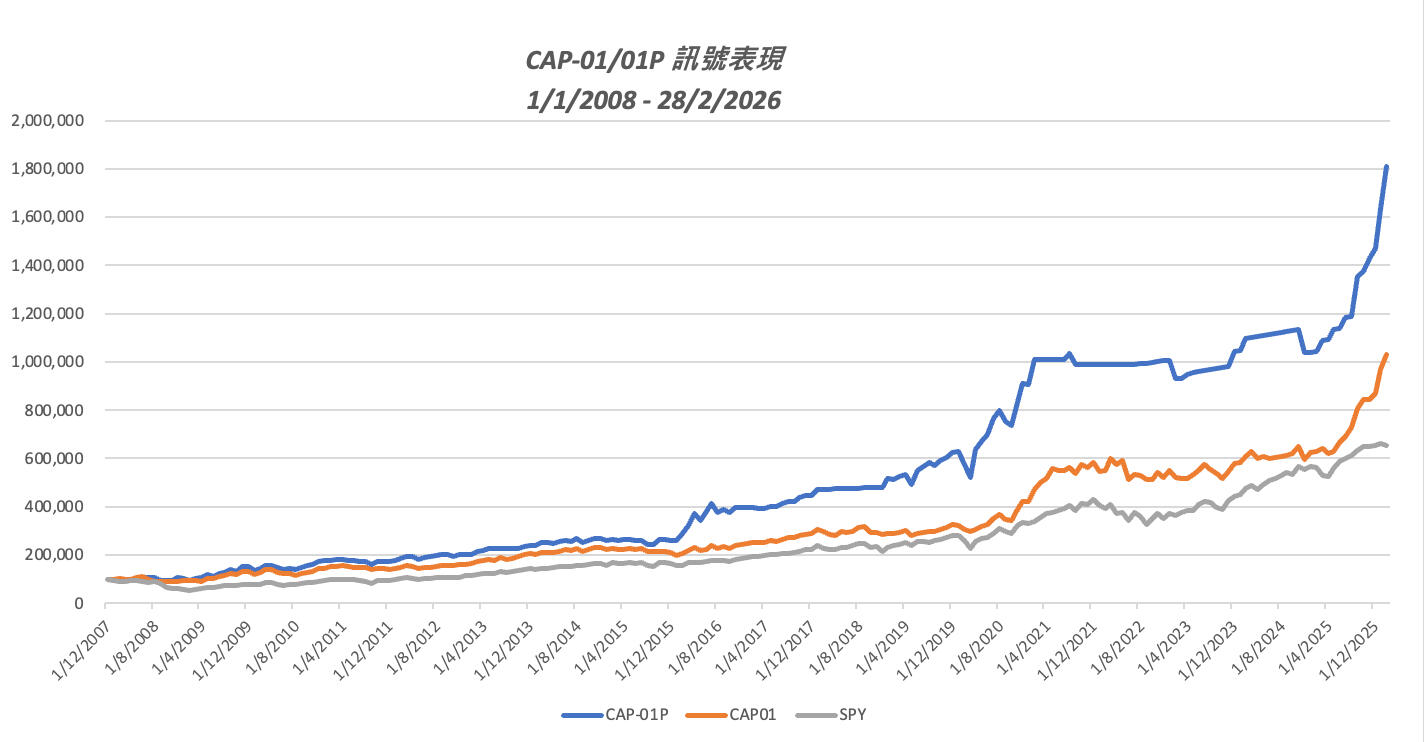
"Hassle-free yet Uncompromised"CAP-01 & CAP-01P are our Signature Models represent the optimal intersection of rigorous risk management and consistent growth potential.By removing human emotion and relying on the Systematic Certainty of the C.A.P. Momentum model, CAP-01 & CAP-01P offer "Set and Forget" sophistication for modern portfolio management.Signals from CAP-01 & CAP-01P provide the strategic intelligence you need to align any mutual fund plan or investment account with global market trends, offering a high degree of flexibility regardless of your choice of provider.If you have unique requirements, we would be delighted to collaborate with you on a fully customized solution.
| 1/1/2008 - 28/2/2026 | INITIAL $ | APPROX. ACC. $ | MAX. DD | WORST YEAR % | WORST YEAR |
|---|---|---|---|---|---|
| CAP-01P | 100,000 | 1,810,000 | -17% | -4% | 2015 |
| CAP-01 | 100,000 | 1,030,000 | -18% | -11% | 2022 |
| SPY | 100,000 | 660,000 | -48% | -37% | 2008 |
| ANN. RETURN (28/2/2026) | 1yr | 3yr | 5yr | 10yr | SINCE 2008 |
|---|---|---|---|---|---|
| CAP-01P | 73% | 25% | 12% | 20% | 17% |
| CAP-01 | 63% | 25% | 17% | 17% | 14% |
| SPY | 17% | 22% | 14% | 15% | 11% |
Note:
- SPY: State Street SPDR S&P 500 ETF
- Returns are total returns on a gross basis
- Results are based on the closing price of the last trading day of each month
CAP-01P
"Hassle-free yet Uncompromised"
MONTHLY RETURN OF CAP-01P
SINCE 2011
(Results are based on the closing price of the last trading day of each month)
| MONTH | 1 | 2 | 3 | 4 | 5 | 6 | 7 | 8 | 9 | 10 | 11 | 12 | TOTAL |
|---|---|---|---|---|---|---|---|---|---|---|---|---|---|
| 2026 | 10.81% | 11.01% | -6.66% | - | - | - | - | - | - | - | - | - | 14.82% |
| 2025 | 0.36% | 0.35% | 4.22% | 0.35% | 3.96% | 0.36% | 4.01% | 0.36% | 13.93% | 1.55% | 3.74% | 3.08% | 41.91% |
| 2024 | 0.45% | 4.67% | 0.44% | 0.44% | 0.44% | 0.44% | 0.44% | 0.22% | 0.30% | 0.26% | 0.38% | -8.41% | -0.41% |
| 2023 | 0.36% | -7.75% | 0.39% | 1.76% | 0.48% | 0.43% | 0.43% | 0.44% | 0.45% | 0.45% | 0.45% | 6.30% | 3.72% |
| 2022 | 0.01% | 0.01% | 0.03% | 0.04% | 0.06% | 0.08% | 0.12% | 0.19% | 0.22% | 0.26% | 0.31% | 0.35% | 1.69% |
| 2021 | -0.31% | 11.36% | 0.00% | 0.00% | 0.00% | 0.00% | 0.01% | 2.39% | -4.42% | 0.00% | 0.00% | 0.00% | 8.68% |
| 2020 | 0.11% | -8.26% | -9.40% | 22.11% | 5.62% | 3.79% | 9.55% | 4.40% | -5.48% | -2.62% | 13.46% | 9.00% | 45.03% |
| 2019 | 7.58% | -0.81% | 2.46% | 1.21% | -7.41% | 11.43% | 3.18% | 3.16% | -2.34% | 3.93% | 2.19% | 3.47% | 30.41% |
| 2018 | 5.60% | 0.12% | 0.13% | 0.14% | 0.15% | 0.16% | 0.16% | 0.16% | 0.17% | 0.18% | 0.19% | 0.19% | 7.46% |
| 2017 | 0.04% | 0.04% | -1.17% | 0.06% | 2.52% | -0.41% | 2.78% | 2.34% | 0.10% | 4.22% | 1.49% | 0.10% | 12.66% |
| 2016 | 0.02% | 11.88% | 11.66% | 14.88% | -8.01% | 10.84% | 9.34% | -9.01% | 3.26% | -3.98% | 5.95% | 0.04% | 53.03% |
| 2015 | -3.05% | 1.79% | -1.46% | 0.88% | 0.75% | -1.65% | 0.00% | -6.82% | 0.01% | 8.43% | 0.25% | -2.05% | -3.55% |
| 2014 | 0.01% | 5.05% | 0.00% | -0.69% | 2.29% | 3.17% | -1.79% | 3.65% | -5.22% | 3.25% | 3.55% | -0.57% | 12.94% |
| 2013 | 0.98% | 0.01% | 4.67% | 2.50% | 3.37% | 0.00% | 0.00% | 0.00% | 0.00% | 0.00% | 3.59% | 1.86% | 18.19% |
| 2012 | 3.36% | 4.16% | 5.03% | -1.37% | -5.32% | 4.33% | 1.35% | 2.63% | 2.86% | -1.24% | -3.49% | 3.71% | 16.51% |
| 2011 | 1.20% | 0.01% | 1.88% | 1.80% | -2.23% | -2.10% | -1.50% | -0.65% | -6.56% | 7.52% | -0.08% | 0.23% | -1.06% |
Note: Returns are total returns on a gross basis. The 'Total' column denotes the annual gross return. For 2026, the return is calculated from the period of January 1 to February 28.
CAP-01
"Hassle-free yet Uncompromised"
MONTHLY RETURN OF CAP-01
SINCE 2011
(Results are based on the closing price of the last trading day of each month)
| MONTH | 1 | 2 | 3 | 4 | 5 | 6 | 7 | 8 | 9 | 10 | 11 | 12 | TOTAL |
|---|---|---|---|---|---|---|---|---|---|---|---|---|---|
| 2026 | 11.63% | 6.26% | -3.41% | - | - | - | - | - | - | - | - | - | 14.57% |
| 2025 | 5.32% | 0.64% | 2.13% | -3.51% | 1.44% | 5.75% | 4.07% | 4.95% | 10.87% | 4.63% | 0.36% | 2.54% | 46.09% |
| 2024 | 0.45% | 4.67% | 2.95% | -4.66% | 1.48% | -1.46% | 1.10% | 0.32% | 0.96% | 1.26% | 4.43% | -8.41% | 2.35% |
| 2023 | 5.22% | -4.84% | -1.44% | 0.78% | 2.68% | 3.44% | 3.97% | -3.25% | -2.94% | -3.70% | 5.29% | 6.30% | 11.14% |
| 2022 | -6.32% | 0.27% | 9.05% | -4.02% | 2.73% | -12.82% | 3.30% | -0.57% | -3.04% | 0.26% | 5.73% | -3.97% | -10.72% |
| 2021 | -0.31% | 11.36% | 6.79% | 2.84% | 8.45% | -2.01% | 0.01% | 2.39% | -4.42% | 7.37% | -2.09% | 3.63% | 38.16% |
| 2020 | -0.45% | -5.28% | -2.89% | 2.44% | 4.35% | 2.41% | 7.45% | 4.81% | -5.04% | -2.03% | 13.46% | 9.00% | 29.91% |
| 2019 | 1.09% | -0.35% | 1.66% | 3.48% | -7.41% | 2.80% | 1.95% | 1.57% | 0.04% | 2.99% | 2.39% | 3.47% | 14.01% |
| 2018 | 5.60% | -3.08% | -4.46% | -1.24% | 5.68% | -1.39% | 2.45% | 4.71% | 1.18% | -7.23% | 0.19% | -2.99% | -1.50% |
| 2017 | 2.28% | 2.24% | -1.17% | 0.56% | 2.52% | -0.41% | 2.78% | 2.34% | 0.10% | 4.22% | 1.49% | 1.21% | 19.61% |
| 2016 | -5.47% | 3.66% | 7.43% | 5.24% | -5.86% | 2.18% | 6.54% | -4.53% | 2.73% | -2.51% | 5.95% | 0.59% | 15.68% |
| 2015 | -3.05% | 1.33% | -1.46% | 0.88% | 0.75% | -1.65% | 2.87% | -6.82% | 0.01% | 0.00% | 0.25% | -2.05% | -8.90% |
| 2014 | -2.28% | 5.05% | 0.00% | -0.69% | 2.29% | 3.17% | -0.55% | 3.65% | -5.22% | 3.25% | 3.55% | -0.57% | 11.75% |
| 2013 | 0.98% | 0.97% | 4.67% | 2.50% | 3.37% | -1.17% | 5.90% | -3.88% | 2.71% | 4.09% | 3.59% | 1.86% | 28.30% |
| 2012 | 3.36% | 1.73% | 5.03% | -1.37% | -5.32% | 1.90% | 1.35% | 2.63% | 2.86% | -1.74% | 0.07% | 3.71% | 14.67% |
| 2011 | 1.20% | 4.49% | 1.88% | 1.80% | -3.66% | -1.83% | -1.50% | -0.02% | -3.69% | 1.96% | 0.61% | -3.25% | -2.34% |
Note: Returns are total returns on a gross basis. The 'Total' column denotes the annual gross return. For 2026, the return is calculated from the period of January 1 to February 28.
© 2026 CapXMomentum. All rights reserved.
MPF REFERENCE
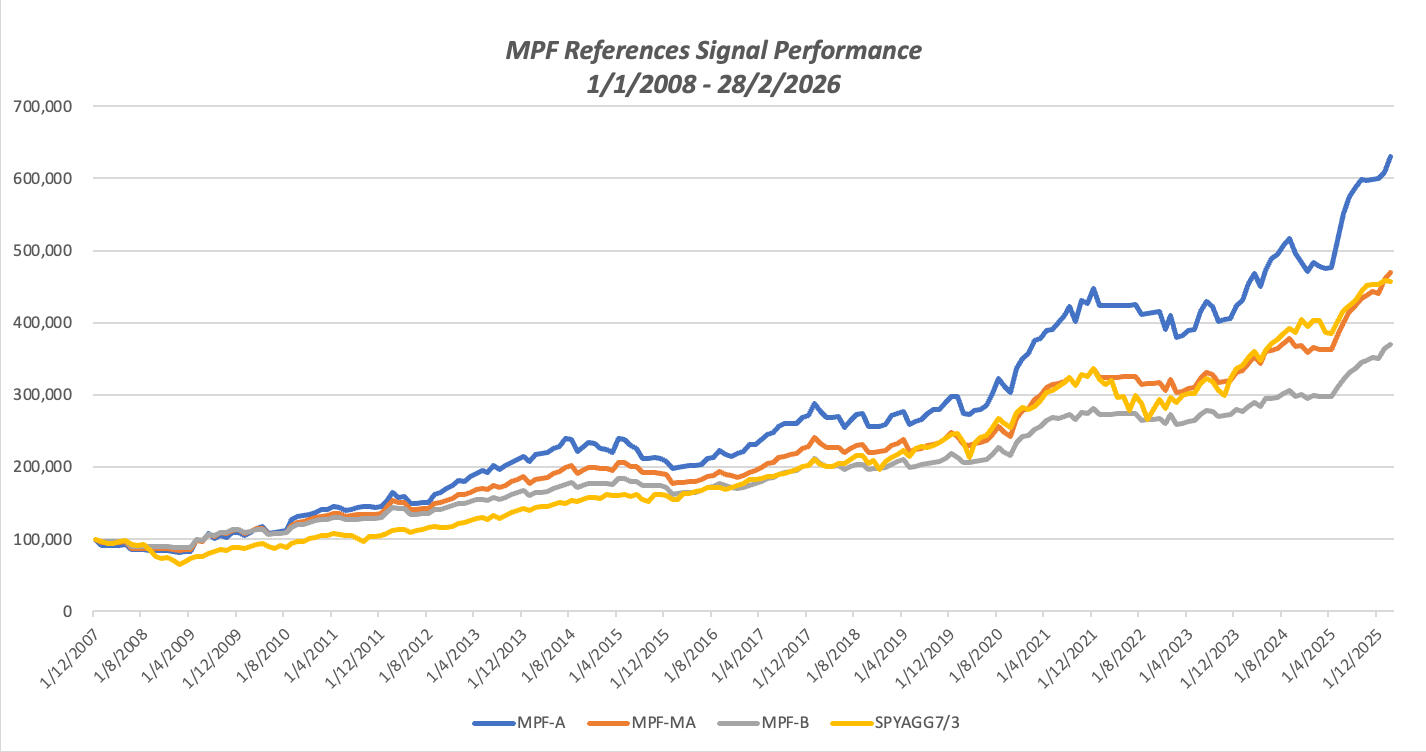
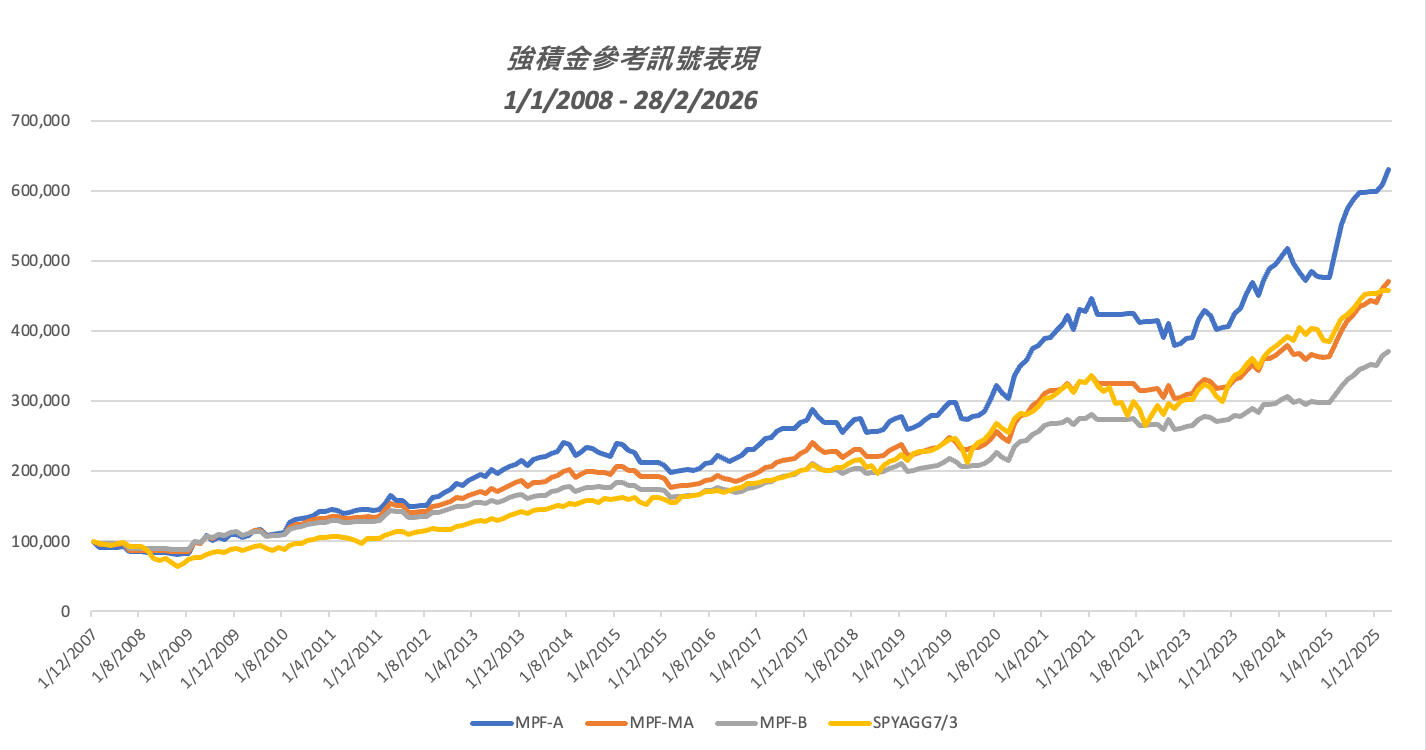
"MPF should work as hard as any other investment in our portfolio"Our system streamlines the investment process by utilizing ETF-driven signals (such as SPY and EWH) to guide your MPF portfolio composition, ensuring your holdings remain precisely aligned with global market trends.To meet a wide range of investment objectives, we offer 3 core reference models.Aggressive (MPF-A): Optimized for maximum long-term growth.Moderately Aggressive (MPF-MA): A growth-focused strategy for long term capital growth.Balanced (MPF-B): Designed for capital growth with a measured approach to risk.If you have unique requirements, we would be delighted to collaborate with you on a fully customized solution.
| 1/1/2008 - 28/2/2026 | INITIAL $ | APPROX. ACC. $ | MAX. DD | WORST YEAR % | WORST YEAR |
|---|---|---|---|---|---|
| MPF-A | 100,000 | 630,000 | -19% | -16% | 2008 |
| MPF-MA | 100,000 | 470,000 | -15% | -13% | 2008 |
| MPF-B | 100,000 | 370,000 | -12% | -11% | 2008 |
| SPYAGG(7/3) | 100,000 | 460,000 | -36% | -25% | 2008 |
| ANN. RETURN (28/2/2026) | 1yr | 3yr | 5yr | 10yr | SINCE 2008 |
|---|---|---|---|---|---|
| MPF-A | 32% | 18% | 11% | 12% | 11% |
| MPF-MA | 29% | 16% | 10% | 10% | 9% |
| MPF-B | 24% | 13% | 8% | 9% | 7% |
| SPYAGG(7/3) | 14% | 17% | 10% | 11% | 9% |
Note:
- SPYAGG(7/3):
70% State Street SPDR S&P 500 ETF & 30% iShares Core US Aggregate Bond ETF
- Returns are total returns on a gross basis
- Results are based on the closing price of the last trading day of each month
MPF-A
"Optimized for maximum long-term growth"
MONTHLY RETURN OF MPF-A
SINCE 2011
(Results are based on the closing price of the last trading day of each month)
| MONTH | 1 | 2 | 3 | 4 | 5 | 6 | 7 | 8 | 9 | 10 | 11 | 12 | TOTAL |
|---|---|---|---|---|---|---|---|---|---|---|---|---|---|
| 2026 | 1.47% | 3.55% | -4.63% | - | - | - | - | - | - | - | - | - | 0.21% |
| 2025 | 2.69% | -1.27% | -0.45% | 0.06% | 8.11% | 7.10% | 4.23% | 2.22% | 1.84% | -0.05% | 0.19% | 0.08% | 27.14% |
| 2024 | 1.59% | 5.22% | 3.27% | -4.03% | 5.06% | 3.53% | 1.21% | 2.34% | 2.10% | -4.23% | -2.41% | -2.51% | 11.03% |
| 2023 | 4.95% | -7.57% | 0.83% | 1.60% | 0.46% | 6.48% | 3.27% | -1.63% | -4.74% | 0.45% | 0.45% | 4.57% | 8.54% |
| 2022 | -5.27% | 0.01% | 0.03% | 0.04% | 0.06% | 0.08% | 0.12% | -3.04% | 0.22% | 0.26% | 0.31% | -5.76% | -12.45% |
| 2021 | 1.70% | 4.99% | 1.03% | 2.60% | 0.66% | 2.25% | 2.44% | 2.98% | -4.66% | 7.02% | -0.80% | 4.63% | 27.24% |
| 2020 | -0.04% | -7.92% | -0.53% | 1.72% | 0.67% | 1.78% | 5.89% | 6.98% | -3.44% | -2.49% | 10.65% | 4.52% | 17.71% |
| 2019 | 0.91% | 4.57% | 1.35% | 1.03% | -6.38% | 1.10% | 1.51% | 2.78% | 1.95% | 0.21% | 3.62% | 2.90% | 16.24% |
| 2018 | 5.64% | -3.83% | -2.74% | 0.14% | 0.15% | -5.37% | 3.70% | 3.19% | 0.59% | -6.91% | 0.19% | 0.19% | -5.67% |
| 2017 | 1.79% | 3.93% | 0.13% | 2.92% | 3.28% | 0.75% | 3.63% | 1.69% | 0.00% | -0.04% | 3.06% | 1.21% | 24.63% |
| 2016 | -4.98% | 0.89% | 0.87% | 0.26% | -0.15% | 1.14% | 3.65% | 0.62% | 4.66% | -2.00% | -1.85% | 2.03% | 4.88% |
| 2015 | -2.96% | -0.89% | -1.57% | 8.48% | -0.46% | -3.48% | -1.46% | -6.10% | 0.01% | 0.07% | -0.39% | -1.72% | -10.57% |
| 2014 | -3.52% | 4.55% | 0.83% | 0.82% | 2.32% | 0.92% | 5.36% | -0.73% | -6.91% | 2.36% | 2.75% | -0.26% | 8.15% |
| 2013 | 4.48% | -0.84% | 3.80% | 1.92% | 2.36% | -1.33% | 5.17% | -3.00% | 3.17% | 1.67% | 1.89% | 2.59% | 23.81% |
| 2012 | 4.64% | 7.96% | -4.38% | 0.60% | -6.01% | -0.02% | 1.36% | 0.00% | 7.12% | 1.65% | 3.30% | 2.32% | 19.12% |
| 2011 | 2.33% | 3.47% | 0.01% | 2.90% | -1.12% | -3.52% | 1.69% | 1.52% | 0.77% | 0.13% | -0.33% | 1.04% | 9.04% |
Note: Returns are total returns on a gross basis. The 'Total' column denotes the annual gross return. For 2026, the return is calculated from the period of January 1 to February 28.
MPF-MA
"A growth-focused strategy for long term capital growth"
MONTHLY RETURN OF MPF-MA
SINCE 2011
(Results are based on the closing price of the last trading day of each month)
| MONTH | 1 | 2 | 3 | 4 | 5 | 6 | 7 | 8 | 9 | 10 | 11 | 12 | TOTAL |
|---|---|---|---|---|---|---|---|---|---|---|---|---|---|
| 2026 | 4.32% | 2.08% | -3.68% | - | - | - | - | - | - | - | - | - | 2.57% |
| 2025 | 1.91% | -0.73% | -0.19% | 0.18% | 5.20% | 4.85% | 3.59% | 2.17% | 2.42% | 0.76% | 1.21% | -0.40% | 22.85% |
| 2024 | 1.01% | 2.99% | 2.48% | -2.54% | 4.79% | 0.19% | 0.95% | 2.04% | 1.84% | -3.12% | 0.38% | -2.47% | 8.55% |
| 2023 | 5.40% | -5.94% | 0.69% | 1.26% | 0.45% | 4.20% | 2.33% | -0.94% | -3.01% | 0.45% | 0.45% | 3.19% | 8.29% |
| 2022 | -3.51% | 0.01% | 0.03% | 0.04% | 0.06% | 0.08% | 0.12% | -3.30% | 0.22% | 0.26% | 0.31% | -3.72% | -9.14% |
| 2021 | 0.80% | 4.25% | 2.20% | 3.49% | 1.45% | 0.31% | 0.83% | 1.92% | -3.41% | 4.68% | -0.53% | 3.09% | 20.50% |
| 2020 | -1.97% | -4.75% | -0.31% | 1.15% | 0.45% | 1.40% | 3.52% | 4.38% | -3.54% | -2.30% | 10.73% | 4.25% | 12.74% |
| 2019 | 0.67% | 3.01% | 1.61% | 2.05% | -6.54% | 0.80% | 1.07% | 1.30% | 1.09% | 0.88% | 2.40% | 3.35% | 11.93% |
| 2018 | 5.30% | -3.77% | -2.18% | 0.14% | 0.15% | -3.53% | 2.52% | 2.32% | 0.19% | -4.55% | 0.19% | 0.19% | -3.42% |
| 2017 | 1.21% | 2.63% | 1.07% | 2.28% | 2.65% | 0.71% | 3.10% | 1.22% | 0.67% | 0.76% | 3.36% | 1.44% | 23.22% |
| 2016 | -6.43% | 0.60% | 0.59% | 0.30% | 0.47% | 0.88% | 2.62% | 0.45% | 3.11% | -1.91% | -1.23% | -0.98% | -1.85% |
| 2015 | -0.14% | -0.53% | -0.92% | 5.55% | 0.12% | -2.99% | -0.22% | -4.06% | 0.01% | 0.05% | -0.26% | -1.24% | -4.83% |
| 2014 | -4.74% | 3.16% | 0.50% | 0.78% | 3.11% | 1.30% | 3.13% | 0.83% | -5.07% | 1.92% | 2.05% | -0.12% | 6.61% |
| 2013 | 2.99% | -0.13% | 2.07% | 2.32% | 0.90% | -0.89% | 3.45% | -2.00% | 2.11% | 2.66% | 2.25% | 1.78% | 18.81% |
| 2012 | 6.17% | 6.75% | -1.85% | 0.18% | -7.10% | -0.01% | 0.91% | 0.00% | 5.59% | 0.49% | 2.39% | 1.85% | 15.59% |
| 2011 | 2.03% | 1.41% | 0.01% | 2.69% | -0.33% | -2.49% | 0.46% | 1.01% | 0.51% | 0.08% | -0.22% | 1.15% | 6.39% |
Note: Returns are total returns on a gross basis. The 'Total' column denotes the annual gross return. For 2026, the return is calculated from the period of January 1 to February 28.
MPF-B
"Designed for capital growth with a measured approach to risk"
MONTHLY RETURN OF MPF-B
SINCE 2011
(Results are based on the closing price of the last trading day of each month)
| MONTH | 1 | 2 | 3 | 4 | 5 | 6 | 7 | 8 | 9 | 10 | 11 | 12 | TOTAL |
|---|---|---|---|---|---|---|---|---|---|---|---|---|---|
| 2026 | 4.13% | 1.54% | -2.86% | - | - | - | - | - | - | - | - | - | 2.71% |
| 2025 | 1.52% | -0.46% | -0.05% | 0.23% | 3.91% | 3.73% | 2.84% | 1.85% | 2.30% | 0.87% | 1.28% | -0.46% | 18.91% |
| 2024 | -0.88% | 2.19% | 2.01% | -1.80% | 4.02% | -0.32% | 0.83% | 1.73% | 1.57% | -2.83% | 0.85% | -1.99% | 5.25% |
| 2023 | 5.13% | -5.09% | 0.61% | 1.06% | 0.44% | 3.19% | 1.85% | -0.59% | -2.15% | 0.45% | 0.45% | 2.50% | 7.73% |
| 2022 | -2.63% | 0.01% | 0.03% | 0.04% | 0.06% | 0.08% | 0.12% | -3.47% | 0.22% | 0.26% | 0.31% | -2.70% | -7.51% |
| 2021 | 0.39% | 3.17% | 2.03% | 3.06% | 1.34% | -0.06% | 0.61% | 1.42% | -2.63% | 3.51% | -0.40% | 2.32% | 15.59% |
| 2020 | -1.94% | -3.41% | -0.20% | 0.87% | 0.34% | 1.11% | 2.76% | 4.47% | -2.98% | -1.98% | 8.95% | 3.51% | 11.38% |
| 2019 | 0.55% | 2.28% | 1.69% | 1.84% | -5.16% | 0.65% | 0.85% | 0.86% | 0.80% | 0.87% | 1.82% | 2.89% | 10.15% |
| 2018 | 4.18% | -3.11% | -1.70% | 0.14% | 0.15% | -2.61% | 1.93% | 1.81% | 0.12% | -3.37% | 0.19% | 0.19% | -2.32% |
| 2017 | 0.92% | 1.99% | 1.04% | 1.94% | 2.22% | 0.59% | 2.55% | 1.10% | 0.58% | 0.78% | 2.83% | 1.25% | 19.27% |
| 2016 | -5.60% | 0.45% | 0.45% | 0.27% | 0.49% | 1.01% | 3.13% | 0.32% | 2.34% | -1.71% | -0.91% | -1.31% | -1.34% |
| 2015 | 0.69% | -0.39% | -0.49% | 4.30% | 0.20% | -2.41% | 0.02% | -3.05% | 0.01% | 0.04% | -0.19% | -0.98% | -2.41% |
| 2014 | -3.90% | 2.40% | 0.37% | 0.64% | 2.92% | 1.14% | 2.19% | 1.14% | -4.02% | 1.53% | 1.59% | -0.08% | 5.80% |
| 2013 | 2.24% | 0.01% | 1.44% | 2.16% | -0.11% | -0.66% | 2.59% | -1.50% | 1.59% | 2.52% | 1.89% | 1.26% | 14.16% |
| 2012 | 5.52% | 5.42% | -1.22% | 0.23% | -5.92% | -0.01% | 0.68% | 0.00% | 4.45% | 0.21% | 1.88% | 1.42% | 12.84% |
| 2011 | 1.64% | 0.84% | 0.01% | 2.21% | -0.07% | -2.19% | 0.18% | 0.76% | 0.39% | 0.06% | -0.17% | 0.97% | 4.67% |
Note: Returns are total returns on a gross basis. The 'Total' column denotes the annual gross return. For 2026, the return is calculated from the period of January 1 to February 28.
© 2026 CapXMomentum. All rights reserved.
Solution
"Systematize Your Portfolio Management"Whether you are an Established Wealth Builder seeking to preserve and grow significant capital, or a Rising Potential Individual building the foundation of your financial future, the core principles of our model remain the same.Our solution provides clear, actionable Monthly Signal to guide your Personal Accounts, even MPF allocations, ensuring you remain aligned with market strength starting from HKD200 per month^.Please visit our signature CAP-01/ 01P and MPF Reference.Don't forget to Contact us today to book a free 30-minute introductory consultation.^ MPF Portfolio Signal from $200/mo; Other Portfolios from $500/mo

© 2026 CapXMomentum. All rights reserved.

ULTIMATE STRESS TEST
"It is how much a strategy keeps under downside pressure that matters most."The wealth preservation capabilities of CAP-01 & CAP-01P contributed significantly to the additional return relative to the market.For an investment of $100,000 on 1 January 2008, that 3%-6% annual outperformance from CAP-01 & CAP-01P provided the compounding engine that led to the final 56% & 174% additional gain in capital (CAP-01: $1,030,000 vs CAP-01P: $1,810,000 vs SPY: $660,000) by 28 February 2026 respectively.
Why
C.A.P. Momentum
Traditional "Buy and Hold" strategies are often subject to the full brunt of market corrections. C.A.P. Momentum utilizes a dynamic rebalancing engine designed to:Identify Leading Trends:
Systematically allocating to assets with the highest relative momentum.Mitigate Capital Erosion:
Actively monitoring absolute momentum to preserve your accumulated wealth.Professional Value:
We don't just chase returns, we manage the journey.
Risk Management in Action
The test of an algorithmic strategy is NOT just how much it gains, but also how much it keeps. Below is a demonstration of our sample strategies compared to their respective benchmarks during the critical market cycles of January 2018 – December 2023.Why this period is critical?
This specific 6-year window serves as the most recent "Ultimate Stress Test" for modern portfolio management because it captures 3 distinct, high-impact market events:2018 Trade War & Quantitative Crunch: A rare cycle where both stocks and bonds declined, testing the ability to achieve asset preservation.2020 Pandemic Shock: One of the fastest market crash and recovery periods in history, testing speed of response and re-entry logic.2022 Inflationary Bear Market: Traditional diversification failed as interest rates rose, requiring pure momentum discipline to protect capital.
1. CAP-01P Strategy (Equities Focus)
Designed for exceptional growth through superior risk controls.
| 1/1/2018 - 31/12/2023 | CAP-01P | Benchmark (SPY) |
|---|---|---|
| Initial Value | $1,000,000 | $1,000,000 |
| Approx. Acc. Value | $2,330,000 | $1,970,000 |
| Total Return | 133% | 97% |
| Annualised Return | 15.14% | 11.96% |
| Max. DD (Drawdown) | -16.88% | -23.93% |
Key Takeaway: During market stress, CAP-01P's algorithmic triggers reduced exposure, resulting in a significantly lower drawdown than the SPY while delivering exceptional return at the same time.
2. MPF-MA Strategy (Rotation between Equities and Bonds)
Designed for steady growth with significantly lower volatility.
| 1/1/2018 - 31/12/2023 | MPF-MA | Benchmark (SPYAGG(7/3)) |
|---|---|---|
| Initial Value | $1,000,000 | $1,000,000 |
| Approx. Acc. Value | $1,450,000 | $1,660,000 |
| Total Return | 45% | 66% |
| Annualised Return | 6.33% | 8.81% |
| Max. DD (Drawdown) | -9.92% | -21.06% |
Key Takeaway: MPF-MA offers a "smoother ride" for the investor, maintaining a single-digit maximum drawdown even when the SPYAGG(7/3) benchmark faced a correction of over 20%.
Note:
- SPY: State Street SPDR S&P 500 ETF
- SPYAGG(7/3): 70% State Street SPDR S&P 500 ETF & 30% iShares Core US Aggregate Bond ETF
- Returns are total returns on a gross basis
- Results are based on the closing price of the last trading day of each month
© 2026 CapXMomentum. All rights reserved.
Contact
We understand that navigating the financial markets requires both precision and a personal touch. Our team is here to provide the clarity you need. Please leave us a message, and we will reach out to discuss how we can help. Back To Home
我們的團隊已準備好為您提供所需的專業見解。請留下您的訊息,我們將儘快聯絡您。返回主頁
Your personal data will be used for processing your inquiries only.
Thank you
Message Sent Successfully!
Thank you for your interest in our systematic wealth-building services. We are excited to help you navigate the markets with data-driven precision. Our strategy specialist will reach out shortly to provide the insights you’re looking for.
訊息已成功發送!
感謝您對我們系統化組合管理服務的關注。我們非常期待能協助您利用數據驅動的精準策略,在市場中穩步前行。我們將盡快與您聯絡,提供您所需的專業見解。
C.A.P. 動能策略
系統化構建財富
為現代投資者打造的實證動能策略

© 2026 CapXMomentum. All rights reserved.
關於我們
「 C.A.P. 動能策略是您財富架構中缺失的引擎 。」一個規劃完善但缺乏動態執行策略的理財方案,猶如一輛沒有引擎的豪華名車。它或許能提供舒適、安全與尊榮感,卻缺乏帶您到目的地所需的基本動力。選擇我們的程式支援動能訊號服務,掌握可靠的動力!

© 2026 CapXMomentum. All rights reserved.

C.A.P. 動能策略
「 完美協同效應 」雙重動能 (Dual Momentum) 提供了精確的入場與出場時機,而 C.A.P. 框架則提供了長期穩定所需的多元化佈局與風險管理依據。- 低波動性: 專為穩健的長期增長而設計
- 趨勢追蹤: 在上升趨勢中買入,並在跌勢開始初期離場
- 數據驅動: 拒絕主觀猜測,完全基於量化規則執行
- 高度靈活性: 在嚴謹邏輯的前提下,策略可根據個人需求進行定制化調整
C.A.P.
「 現代投資組合管理的紀律框架 」C.A.P. 框架是一套戰術性資產配置策略,旨在透過3大核心支柱管理您的投資組合:C – Cash (現金防禦): 當投資市場環境惡化時,策略性地增持現金以規避風險
A – Allocation (系統配置): 根據系統化規則,將資金分配至選定的資產類別
P – Pick (精選標的): 專注於具備高品質與高增長潛力的資產選項
雙重動能策略
(Dual Momentum)
「 擁抱動能 」我們採用雙重量化篩選機制,旨在捕捉牛市升幅並規避熊市風險。簡化說明:
第 1 步: 相對動能檢測
資產 A 的表現是否優於資產 B?
(例如:美股與國際股市之比較)第 2 步: 絕對動能檢測
該領先資產的表現是否優於現金或防禦性資產?
是: 買入領先資產
否: 持有現金或防禦性資產
© 2026 CapXMomentum. All rights reserved.
CAP-01 及 CAP-01P
「 自在無憂卻不妥協 」CAP-01 及 CAP-01P 是我們的旗艦模型,代表著嚴謹風險管理與持續增長潛力的最佳交匯點。透過排除情緒干擾並依據 C.A.P. 動能策略框架的系統化確認,CAP-01 及 CAP-01P 為現代投資組合管理提供了自在無憂的解決方案。來自 CAP-01 及 CAP-01P 的訊號提供您所需的策略情報,享有極高的靈活性,讓您現有的任何基金計劃或投資賬戶都能與全球市場趨勢保持一致, 給你一份無拘束的自信。我們亦樂於為您的特定需求量身打造專屬的定制方案。
| 1/1/2008 - 28/2/2026 | 初始價值 $ | 大約累計價值 $ | 最大回撤 | 最差周年回報 | 最差表現年份 |
|---|---|---|---|---|---|
| CAP-01P | 100,000 | 1,810,000 | -17% | -4% | 2015 |
| CAP-01 | 100,000 | 1,030,000 | -18% | -11% | 2022 |
| SPY (S&P500) | 100,000 | 660,000 | -48% | -37% | 2008 |
| 年化回報 (28/2/2026) | 1年 | 3年 | 5年 | 10年 | 自 2008 |
|---|---|---|---|---|---|
| CAP-01P | 73% | 25% | 12% | 20% | 17% |
| CAP-01 | 63% | 25% | 17% | 17% | 14% |
| SPY (S&P500) | 17% | 22% | 14% | 15% | 11% |
備註:
- SPY: State Street SPDR S&P 500 ETF
- 回報率為毛利率,按總回報基準計算
- 以每月最後一個交易日資產收市價格計算
CAP-01P
「 自在無憂卻不妥協 」
CAP-01P 自2011年的每月回報
(以每月最後一個交易日資產收市價格計算)
| 月 | 1 | 2 | 3 | 4 | 5 | 6 | 7 | 8 | 9 | 10 | 11 | 12 | 總計 |
|---|---|---|---|---|---|---|---|---|---|---|---|---|---|
| 2026 | 10.81% | 11.01% | -6.66% | - | - | - | - | - | - | - | - | - | 14.82% |
| 2025 | 0.36% | 0.35% | 4.22% | 0.35% | 3.96% | 0.36% | 4.01% | 0.36% | 13.93% | 1.55% | 3.74% | 3.08% | 41.91% |
| 2024 | 0.45% | 4.67% | 0.44% | 0.44% | 0.44% | 0.44% | 0.44% | 0.22% | 0.30% | 0.26% | 0.38% | -8.41% | -0.41% |
| 2023 | 0.36% | -7.75% | 0.39% | 1.76% | 0.48% | 0.43% | 0.43% | 0.44% | 0.45% | 0.45% | 0.45% | 6.30% | 3.72% |
| 2022 | 0.01% | 0.01% | 0.03% | 0.04% | 0.06% | 0.08% | 0.12% | 0.19% | 0.22% | 0.26% | 0.31% | 0.35% | 1.69% |
| 2021 | -0.31% | 11.36% | 0.00% | 0.00% | 0.00% | 0.00% | 0.01% | 2.39% | -4.42% | 0.00% | 0.00% | 0.00% | 8.68% |
| 2020 | 0.11% | -8.26% | -9.40% | 22.11% | 5.62% | 3.79% | 9.55% | 4.40% | -5.48% | -2.62% | 13.46% | 9.00% | 45.03% |
| 2019 | 7.58% | -0.81% | 2.46% | 1.21% | -7.41% | 11.43% | 3.18% | 3.16% | -2.34% | 3.93% | 2.19% | 3.47% | 30.41% |
| 2018 | 5.60% | 0.12% | 0.13% | 0.14% | 0.15% | 0.16% | 0.16% | 0.16% | 0.17% | 0.18% | 0.19% | 0.19% | 7.46% |
| 2017 | 0.04% | 0.04% | -1.17% | 0.06% | 2.52% | -0.41% | 2.78% | 2.34% | 0.10% | 4.22% | 1.49% | 0.10% | 12.66% |
| 2016 | 0.02% | 11.88% | 11.66% | 14.88% | -8.01% | 10.84% | 9.34% | -9.01% | 3.26% | -3.98% | 5.95% | 0.04% | 53.03% |
| 2015 | -3.05% | 1.79% | -1.46% | 0.88% | 0.75% | -1.65% | 0.00% | -6.82% | 0.01% | 8.43% | 0.25% | -2.05% | -3.55% |
| 2014 | 0.01% | 5.05% | 0.00% | -0.69% | 2.29% | 3.17% | -1.79% | 3.65% | -5.22% | 3.25% | 3.55% | -0.57% | 12.94% |
| 2013 | 0.98% | 0.01% | 4.67% | 2.50% | 3.37% | 0.00% | 0.00% | 0.00% | 0.00% | 0.00% | 3.59% | 1.86% | 18.19% |
| 2012 | 3.36% | 4.16% | 5.03% | -1.37% | -5.32% | 4.33% | 1.35% | 2.63% | 2.86% | -1.24% | -3.49% | 3.71% | 16.51% |
| 2011 | 1.20% | 0.01% | 1.88% | 1.80% | -2.23% | -2.10% | -1.50% | -0.65% | -6.56% | 7.52% | -0.08% | 0.23% | -1.06% |
備註: 回報率為毛利率,按總回報基準計算;「總計」欄位代表年度總回報;2026 年之總計回報率計算期為 1 月 1 日至 2 月 28 日。
CAP-01
「 自在無憂卻不妥協 」
CAP-01 自2011年的每月回報
(以每月最後一個交易日資產收市價格計算)
| 月 | 1 | 2 | 3 | 4 | 5 | 6 | 7 | 8 | 9 | 10 | 11 | 12 | 總計 |
|---|---|---|---|---|---|---|---|---|---|---|---|---|---|
| 2026 | 11.63% | 6.26% | -3.41% | - | - | - | - | - | - | - | - | - | 14.57% |
| 2025 | 5.32% | 0.64% | 2.13% | -3.51% | 1.44% | 5.75% | 4.07% | 4.95% | 10.87% | 4.63% | 0.36% | 2.54% | 46.09% |
| 2024 | 0.45% | 4.67% | 2.95% | -4.66% | 1.48% | -1.46% | 1.10% | 0.32% | 0.96% | 1.26% | 4.43% | -8.41% | 2.35% |
| 2023 | 5.22% | -4.84% | -1.44% | 0.78% | 2.68% | 3.44% | 3.97% | -3.25% | -2.94% | -3.70% | 5.29% | 6.30% | 11.14% |
| 2022 | -6.32% | 0.27% | 9.05% | -4.02% | 2.73% | -12.82% | 3.30% | -0.57% | -3.04% | 0.26% | 5.73% | -3.97% | -10.72% |
| 2021 | -0.31% | 11.36% | 6.79% | 2.84% | 8.45% | -2.01% | 0.01% | 2.39% | -4.42% | 7.37% | -2.09% | 3.63% | 38.16% |
| 2020 | -0.45% | -5.28% | -2.89% | 2.44% | 4.35% | 2.41% | 7.45% | 4.81% | -5.04% | -2.03% | 13.46% | 9.00% | 29.91% |
| 2019 | 1.09% | -0.35% | 1.66% | 3.48% | -7.41% | 2.80% | 1.95% | 1.57% | 0.04% | 2.99% | 2.39% | 3.47% | 14.01% |
| 2018 | 5.60% | -3.08% | -4.46% | -1.24% | 5.68% | -1.39% | 2.45% | 4.71% | 1.18% | -7.23% | 0.19% | -2.99% | -1.50% |
| 2017 | 2.28% | 2.24% | -1.17% | 0.56% | 2.52% | -0.41% | 2.78% | 2.34% | 0.10% | 4.22% | 1.49% | 1.21% | 19.61% |
| 2016 | -5.47% | 3.66% | 7.43% | 5.24% | -5.86% | 2.18% | 6.54% | -4.53% | 2.73% | -2.51% | 5.95% | 0.59% | 15.68% |
| 2015 | -3.05% | 1.33% | -1.46% | 0.88% | 0.75% | -1.65% | 2.87% | -6.82% | 0.01% | 0.00% | 0.25% | -2.05% | -8.90% |
| 2014 | -2.28% | 5.05% | 0.00% | -0.69% | 2.29% | 3.17% | -0.55% | 3.65% | -5.22% | 3.25% | 3.55% | -0.57% | 11.75% |
| 2013 | 0.98% | 0.97% | 4.67% | 2.50% | 3.37% | -1.17% | 5.90% | -3.88% | 2.71% | 4.09% | 3.59% | 1.86% | 28.30% |
| 2012 | 3.36% | 1.73% | 5.03% | -1.37% | -5.32% | 1.90% | 1.35% | 2.63% | 2.86% | -1.74% | 0.07% | 3.71% | 14.67% |
| 2011 | 1.20% | 4.49% | 1.88% | 1.80% | -3.66% | -1.83% | -1.50% | -0.02% | -3.69% | 1.96% | 0.61% | -3.25% | -2.34% |
備註: 回報率為毛利率,按總回報基準計算;「總計」欄位代表年度總回報;2026 年之總計回報率計算期為 1 月 1 日至 2 月 28 日。
© 2026 CapXMomentum. All rights reserved.
強積金參考訊號
「 讓我們的強積金與其他資產一樣努力增長」我們的系統運用 ETF (如 SPY 與 EWH)作基礎,驅動訊號來引導您的強積金投資組合配置,化繁為簡,並確保您的持倉與全球市場趨勢保持一致。為滿足不同投資目標,我們提供 3 種核心參考訊號模型。進取型 (MPF-A): 專為追求最大化長線增長而設穩健進取型 (MPF-MA): 專注於長期資本增長的策略平衡型 (MPF-B): 兼顧資本增長與風險平衡的穩健方案我們亦樂於為您的特定需求量身打造專屬的定制方案。
| 1/1/2008 - 28/2/2026 | 初始價值 $ | 大約累計價值 $ | 最大回撤 | 最差周年回報 | 最差表現年份 |
|---|---|---|---|---|---|
| MPF-A | 100,000 | 630,000 | -19% | -16% | 2008 |
| MPF-MA | 100,000 | 470,000 | -15% | -13% | 2008 |
| MPF-B | 100,000 | 370,000 | -12% | -11% | 2008 |
| SPYAGG(7/3) | 100,000 | 460,000 | -36% | -25% | 2008 |
| 年化回報 (28/2/2026) | 1年 | 3年 | 5年 | 10年 | 自 2008 |
|---|---|---|---|---|---|
| MPF-A | 32% | 18% | 11% | 12% | 11% |
| MPF-MA | 29% | 16% | 10% | 10% | 9% |
| MPF-B | 24% | 13% | 8% | 9% | 7% |
| SPYAGG(7/3) | 14% | 17% | 10% | 11% | 9% |
備註:
- SPYAGG(7/3):
70% State Street SPDR S&P 500 ETF & 30% iShares Core US Aggregate Bond ETF
- 回報率為毛利率,按總回報基準計算
- 以每月最後一個交易日資產收市價格計算
MPF-A
「 專為追求最大化長線增長而設 」
MPF-A 自2011年的每月回報
(以每月最後一個交易日資產收市價格計算)
| 月 | 1 | 2 | 3 | 4 | 5 | 6 | 7 | 8 | 9 | 10 | 11 | 12 | 總計 |
|---|---|---|---|---|---|---|---|---|---|---|---|---|---|
| 2026 | 1.47% | 3.55% | -4.63% | - | - | - | - | - | - | - | - | - | 0.21% |
| 2025 | 2.69% | -1.27% | -0.45% | 0.06% | 8.11% | 7.10% | 4.23% | 2.22% | 1.84% | -0.05% | 0.19% | 0.08% | 27.14% |
| 2024 | 1.59% | 5.22% | 3.27% | -4.03% | 5.06% | 3.53% | 1.21% | 2.34% | 2.10% | -4.23% | -2.41% | -2.51% | 11.03% |
| 2023 | 4.95% | -7.57% | 0.83% | 1.60% | 0.46% | 6.48% | 3.27% | -1.63% | -4.74% | 0.45% | 0.45% | 4.57% | 8.54% |
| 2022 | -5.27% | 0.01% | 0.03% | 0.04% | 0.06% | 0.08% | 0.12% | -3.04% | 0.22% | 0.26% | 0.31% | -5.76% | -12.45% |
| 2021 | 1.70% | 4.99% | 1.03% | 2.60% | 0.66% | 2.25% | 2.44% | 2.98% | -4.66% | 7.02% | -0.80% | 4.63% | 27.24% |
| 2020 | -0.04% | -7.92% | -0.53% | 1.72% | 0.67% | 1.78% | 5.89% | 6.98% | -3.44% | -2.49% | 10.65% | 4.52% | 17.71% |
| 2019 | 0.91% | 4.57% | 1.35% | 1.03% | -6.38% | 1.10% | 1.51% | 2.78% | 1.95% | 0.21% | 3.62% | 2.90% | 16.24% |
| 2018 | 5.64% | -3.83% | -2.74% | 0.14% | 0.15% | -5.37% | 3.70% | 3.19% | 0.59% | -6.91% | 0.19% | 0.19% | -5.67% |
| 2017 | 1.79% | 3.93% | 0.13% | 2.92% | 3.28% | 0.75% | 3.63% | 1.69% | 0.00% | -0.04% | 3.06% | 1.21% | 24.63% |
| 2016 | -4.98% | 0.89% | 0.87% | 0.26% | -0.15% | 1.14% | 3.65% | 0.62% | 4.66% | -2.00% | -1.85% | 2.03% | 4.88% |
| 2015 | -2.96% | -0.89% | -1.57% | 8.48% | -0.46% | -3.48% | -1.46% | -6.10% | 0.01% | 0.07% | -0.39% | -1.72% | -10.57% |
| 2014 | -3.52% | 4.55% | 0.83% | 0.82% | 2.32% | 0.92% | 5.36% | -0.73% | -6.91% | 2.36% | 2.75% | -0.26% | 8.15% |
| 2013 | 4.48% | -0.84% | 3.80% | 1.92% | 2.36% | -1.33% | 5.17% | -3.00% | 3.17% | 1.67% | 1.89% | 2.59% | 23.81% |
| 2012 | 4.64% | 7.96% | -4.38% | 0.60% | -6.01% | -0.02% | 1.36% | 0.00% | 7.12% | 1.65% | 3.30% | 2.32% | 19.12% |
| 2011 | 2.33% | 3.47% | 0.01% | 2.90% | -1.12% | -3.52% | 1.69% | 1.52% | 0.77% | 0.13% | -0.33% | 1.04% | 9.04% |
備註: 回報率為毛利率,按總回報基準計算;「總計」欄位代表年度總回報;2026 年之總計回報率計算期為 1 月 1 日至 2 月 28 日。
MPF-MA
「 專注於長期資本增長的策略 」
MPF-MA 自2011年的每月回報
(以每月最後一個交易日資產收市價格計算)
| 月 | 1 | 2 | 3 | 4 | 5 | 6 | 7 | 8 | 9 | 10 | 11 | 12 | 總計 |
|---|---|---|---|---|---|---|---|---|---|---|---|---|---|
| 2026 | 4.32% | 2.08% | -3.68% | - | - | - | - | - | - | - | - | - | 2.57% |
| 2025 | 1.91% | -0.73% | -0.19% | 0.18% | 5.20% | 4.85% | 3.59% | 2.17% | 2.42% | 0.76% | 1.21% | -0.40% | 22.85% |
| 2024 | 1.01% | 2.99% | 2.48% | -2.54% | 4.79% | 0.19% | 0.95% | 2.04% | 1.84% | -3.12% | 0.38% | -2.47% | 8.55% |
| 2023 | 5.40% | -5.94% | 0.69% | 1.26% | 0.45% | 4.20% | 2.33% | -0.94% | -3.01% | 0.45% | 0.45% | 3.19% | 8.29% |
| 2022 | -3.51% | 0.01% | 0.03% | 0.04% | 0.06% | 0.08% | 0.12% | -3.30% | 0.22% | 0.26% | 0.31% | -3.72% | -9.14% |
| 2021 | 0.80% | 4.25% | 2.20% | 3.49% | 1.45% | 0.31% | 0.83% | 1.92% | -3.41% | 4.68% | -0.53% | 3.09% | 20.50% |
| 2020 | -1.97% | -4.75% | -0.31% | 1.15% | 0.45% | 1.40% | 3.52% | 4.38% | -3.54% | -2.30% | 10.73% | 4.25% | 12.74% |
| 2019 | 0.67% | 3.01% | 1.61% | 2.05% | -6.54% | 0.80% | 1.07% | 1.30% | 1.09% | 0.88% | 2.40% | 3.35% | 11.93% |
| 2018 | 5.30% | -3.77% | -2.18% | 0.14% | 0.15% | -3.53% | 2.52% | 2.32% | 0.19% | -4.55% | 0.19% | 0.19% | -3.42% |
| 2017 | 1.21% | 2.63% | 1.07% | 2.28% | 2.65% | 0.71% | 3.10% | 1.22% | 0.67% | 0.76% | 3.36% | 1.44% | 23.22% |
| 2016 | -6.43% | 0.60% | 0.59% | 0.30% | 0.47% | 0.88% | 2.62% | 0.45% | 3.11% | -1.91% | -1.23% | -0.98% | -1.85% |
| 2015 | -0.14% | -0.53% | -0.92% | 5.55% | 0.12% | -2.99% | -0.22% | -4.06% | 0.01% | 0.05% | -0.26% | -1.24% | -4.83% |
| 2014 | -4.74% | 3.16% | 0.50% | 0.78% | 3.11% | 1.30% | 3.13% | 0.83% | -5.07% | 1.92% | 2.05% | -0.12% | 6.61% |
| 2013 | 2.99% | -0.13% | 2.07% | 2.32% | 0.90% | -0.89% | 3.45% | -2.00% | 2.11% | 2.66% | 2.25% | 1.78% | 18.81% |
| 2012 | 6.17% | 6.75% | -1.85% | 0.18% | -7.10% | -0.01% | 0.91% | 0.00% | 5.59% | 0.49% | 2.39% | 1.85% | 15.59% |
| 2011 | 2.03% | 1.41% | 0.01% | 2.69% | -0.33% | -2.49% | 0.46% | 1.01% | 0.51% | 0.08% | -0.22% | 1.15% | 6.39% |
備註: 回報率為毛利率,按總回報基準計算;「總計」欄位代表年度總回報;2026 年之總計回報率計算期為 1 月 1 日至 2 月 28 日。
MPF-B
「 旨在兼顧資本增長與風險平衡的穩健方案 」
MPF-B 自2011年的每月回報
(以每月最後一個交易日資產收市價格計算)
| 月 | 1 | 2 | 3 | 4 | 5 | 6 | 7 | 8 | 9 | 10 | 11 | 12 | 總計 |
|---|---|---|---|---|---|---|---|---|---|---|---|---|---|
| 2026 | 4.13% | 1.54% | -2.86% | - | - | - | - | - | - | - | - | - | 2.71% |
| 2025 | 1.52% | -0.46% | -0.05% | 0.23% | 3.91% | 3.73% | 2.84% | 1.85% | 2.30% | 0.87% | 1.28% | -0.46% | 18.91% |
| 2024 | -0.88% | 2.19% | 2.01% | -1.80% | 4.02% | -0.32% | 0.83% | 1.73% | 1.57% | -2.83% | 0.85% | -1.99% | 5.25% |
| 2023 | 5.13% | -5.09% | 0.61% | 1.06% | 0.44% | 3.19% | 1.85% | -0.59% | -2.15% | 0.45% | 0.45% | 2.50% | 7.73% |
| 2022 | -2.63% | 0.01% | 0.03% | 0.04% | 0.06% | 0.08% | 0.12% | -3.47% | 0.22% | 0.26% | 0.31% | -2.70% | -7.51% |
| 2021 | 0.39% | 3.17% | 2.03% | 3.06% | 1.34% | -0.06% | 0.61% | 1.42% | -2.63% | 3.51% | -0.40% | 2.32% | 15.59% |
| 2020 | -1.94% | -3.41% | -0.20% | 0.87% | 0.34% | 1.11% | 2.76% | 4.47% | -2.98% | -1.98% | 8.95% | 3.51% | 11.38% |
| 2019 | 0.55% | 2.28% | 1.69% | 1.84% | -5.16% | 0.65% | 0.85% | 0.86% | 0.80% | 0.87% | 1.82% | 2.89% | 10.15% |
| 2018 | 4.18% | -3.11% | -1.70% | 0.14% | 0.15% | -2.61% | 1.93% | 1.81% | 0.12% | -3.37% | 0.19% | 0.19% | -2.32% |
| 2017 | 0.92% | 1.99% | 1.04% | 1.94% | 2.22% | 0.59% | 2.55% | 1.10% | 0.58% | 0.78% | 2.83% | 1.25% | 19.27% |
| 2016 | -5.60% | 0.45% | 0.45% | 0.27% | 0.49% | 1.01% | 3.13% | 0.32% | 2.34% | -1.71% | -0.91% | -1.31% | -1.34% |
| 2015 | 0.69% | -0.39% | -0.49% | 4.30% | 0.20% | -2.41% | 0.02% | -3.05% | 0.01% | 0.04% | -0.19% | -0.98% | -2.41% |
| 2014 | -3.90% | 2.40% | 0.37% | 0.64% | 2.92% | 1.14% | 2.19% | 1.14% | -4.02% | 1.53% | 1.59% | -0.08% | 5.80% |
| 2013 | 2.24% | 0.01% | 1.44% | 2.16% | -0.11% | -0.66% | 2.59% | -1.50% | 1.59% | 2.52% | 1.89% | 1.26% | 14.16% |
| 2012 | 5.52% | 5.42% | -1.22% | 0.23% | -5.92% | -0.01% | 0.68% | 0.00% | 4.45% | 0.21% | 1.88% | 1.42% | 12.84% |
| 2011 | 1.64% | 0.84% | 0.01% | 2.21% | -0.07% | -2.19% | 0.18% | 0.76% | 0.39% | 0.06% | -0.17% | 0.97% | 4.67% |
備註: 回報率為毛利率,按總回報基準計算;「總計」欄位代表年度總回報;2026 年之總計回報率計算期為 1 月 1 日至 2 月 28 日。
© 2026 CapXMomentum. All rights reserved.
方案
「 系統化管理投資組合 」無論您是尋求資產保值與增長的高資產值人士,還是正在努力構建未來基石的新進潛力人才,我們模型的核心原則始終如一。我們的方案提供清晰、便捷可行的每月訊號,指引您的個人賬戶以至強積金配置,確保您從每月港幣 200 元起^,即可緊貼環球市場趨勢。誠邀閣下瀏覽我們的旗艦 CAP-01/ 01P 及強積金參考 訊號專頁。最緊要記得聯絡我們,預約一次 30 分鐘的免費諮詢。^ 強積金組合訊號收費每月 $200 起,其他組合每月 $500 起

© 2026 CapXMomentum. All rights reserved.

極限壓力測試
「一個策略在面臨下行壓力時的抗跌能力才是關鍵。」CAP-01 及 CAP-01P 的資產保護能力,對其相對於市場的額外收益有著不可或缺的貢獻。若在 2008 年 1 月 1 日投資 $100,000 資本,CAP-01 及 CAP-01P 的 3%-6% 每年平均額外收益所產生的複利效應, 帶來截至 2026 年 2 月 28 日,分別 56% 及 174% 的額外回報 ( CAP-01:$1,030,000 vs CAP-01P:$1,810,000 vs SPY:$660,000 )。
C.A.P. 動能策略的優點
傳統的「買入並持有」策略往往在市場回調時受到全盤衝擊。
C.A.P. 動能策略 則運用動態再平衡系統,達成以下目標:識別領先趨勢:
透過系統化配置,投入具有最高相對動能的資產。減緩資本侵蝕:
配合絕對動能,主動監控資產動態,以守護已累積的財富。專業價值:
我們不單純追逐回報,我們更提供「自在無憂」的體驗。
風險管理措施在實戰中的表現
評測演算法策略的標準,不只在於它能賺多少,而更在於它能守住多少。以下展示了我們的範例策略在 2018 年 1 月至 2023 年 12 月這一段關鍵市場週期中,與其各自基準指標的表現。為何這段時期至關重要?
這特定的 6 年期間,堪稱現代投資組合管理的「終極壓力考驗」,因為它涵蓋了三次截然不同且具高度影響力的市場事件。2018 年貿易戰與量化程式交易衝擊:
這段極為罕見股債雙跌的時期,考驗策略對「資產保護」的能力。2020 年疫情衝擊:
這是史上其中一個速度最快的市場崩跌與復甦,考驗了策略的反應速度以及重新入場的邏輯。2022 年通膨熊市:
在利率上升的環境下,傳統的多元資產配置宣告失效,此時必須倚賴動能監控及紀律來守護資本。
1. CAP-01P 策略(聚焦股票資產)
透過卓越的風險控管,追求超越整體股票市場的非凡表現。
| 1/1/2018 - 31/12/2023 | CAP-01P | 基準指標 (SPY) |
|---|---|---|
| 最初投資金額 | $1,000,000 | $1,000,000 |
| 累計價值約 | $2,330,000 | $1,970,000 |
| 期間總回報 | 133% | 97% |
| 年化回報 | 15.14% | 11.96% |
| 期間最大回撤 | -16.88% | -23.93% |
核心要點:在市場承壓期間,CAP-01P 的演算法能有效減輕持倉,使其最大回撤顯著低於 SPY,同時回報表現理想。
2. MPF-MA 策略(股債輪動配置)
透過顯著降低波動性,達至資產的穩健增長。
| 1/1/2018 - 31/12/2023 | MPF-MA | 基準指標 (SPYAGG(7/3)) |
|---|---|---|
| 最初投資金額 | $1,000,000 | $1,000,000 |
| 累計價值約 | $1,450,000 | $1,660,000 |
| 期間總回報 | 45% | 66% |
| 年化回報 | 6.33% | 8.81% |
| 期間最大回撤 | -9.92% | -21.06% |
核心要點: MPF-MA 為投資者提供了「較平穩的投資歷程」;即使在基準指標 SPYAGG(7/3) 面臨超過 20% 的大幅修正時,該策略仍維持最大回撤在個位數。
備註:
- SPY: State Street SPDR S&P 500 ETF
- SPYAGG(7/3):
70% State Street SPDR S&P 500 ETF & 30% iShares Core US Aggregate Bond ETF
- 回報率為毛利率,按總回報基準計算
- 以每月最後一個交易日資產收市價格計算
© 2026 CapXMomentum. All rights reserved.
Disclaimer & Important Notice
IMPORTANT: Investment Involves RiskThis website is prepared by CapxMomentum for general informational purposes only and does not constitute legal, tax, investment, or other professional advice.No Offer: Nothing on this website shall be construed as an offer, solicitation, or recommendation of any investment product or service.Investment Risk: Investment involves risk. The price of securities or investment products may move up or down and may become valueless. Past performance is not indicative of future results. Before making any investment decision, you should consider your financial situation and risk tolerance, and consult independent professional advisors.Accuracy of Information: While we strive to ensure accuracy, CapxMomentum makes no representation or warranty regarding the completeness or timeliness of the information. We accept no liability for any loss arising from the use of this website.
免責聲明及重要告示
重要提示:投資涉及風險本網站所載的資料由 CapxMomentum 編製,僅供一般參考之用,不構成任何法律、稅務、投資或其他專業建議。非要約行為:本網站內容不構成任何投資產品或服務的要約、招攬或建議。投資風險:投資涉及風險。證券或投資產品的價格可升亦可跌,甚至變成毫無價值。過往表現並非未來表現的指標。在作出任何投資決定前,投資者應考慮自身的財務狀況及風險承受能力,並諮詢獨立專業顧問。資料準確性:雖然我們盡力確保資料準確,但 CapxMomentum 並不保證資料的完整性或及時性。對於因使用本網站資料而導致的任何損失,本公司概不負責。